The research shows that the next financial crisis is just around the corner. Find out which financial assets are the most exposed to it and how to insulate your portfolio.

“It wasn’t raining when Noah built the ark”
– Howard Ruf

We’ve been in the longest bull market in recent history with ten consecutive years of stock market growth under our belt. Since 2008, a vast number of millennial have also entered the workforce and a sizeable of them became investors themselves. We are talking about a whole generation of people who are in the market and yet have never personally experienced a market downturn. It is therefore very easy to be complacent and extrapolate the wonderful performance of the past decade infinitely into the future.

However, history tells us that market cycles are repeating themselves. External circumstances may change and yet excess greed and fear remain constant, giving rise booms and busts. It is dangerous to make linear extrapolation using past performance and expect it to continue indefinitely.

We are at a stage where “peak valuation” is in sight. What often follows is either a soft (correction) or hard (crash) landing. But a landing nevertheless. It is therefore important to take measures and actively protect your portfolio no matter what the outcome is in the next 24 months.

In this post, we will walk through:

  1. Why do crises happen?
  2. Evidence that the next one is imminent
  3. Which assets are most at-risk?
  4. What can you do to mitigate the risk?

Note: We will be mainly referring to the US and UK markets in this article as they are the major market-drivers. The Dollar is also the main international currency.


Why do crises happen?

Recessions have been making regular appearances in our economic history for a variety of reasons (e.g. economic mismanagement, wars, diseases, human greed). For the past 120 years and with the exception of the two world wars, recessions in developed economies tend to be the byproduct of the boom-bust cycle, often fuelled by easy access to capital.
The most recent downturn (the 2007-09 Great Recession) was a classic example of the credit-fuelled cycle:

  • After the Dot Com Bubble, credit became readily available, reaching a peak in 2006 with subprime mortgage lending occupying 20% of total mortgage underwritten;
  • Asset prices (US property price specifically but financial assets in general) became increasingly inflated and often exceeding their intrinsic value;
  • This was followed by other investors entering the market in the hope of making greater returns (herd mentality), further pushing up asset price;
  • When subprime borrowers started to default on their mortgages en mass, as the teaser rates expired and the monthly repayment became unaffordable;
  • Lenders were suddenly faced with a book of bad loans, which led them to do 2 things:
  • Repossess these properties en mass: this led to a sudden increase in property supply without matching demand, cause a drastic fall in the US property price;
  • Tighten lending criteria across the board: often indiscriminately, which starved companies off capital and suffocating growth
    The economic outlook suddenly became less positive than before, which caused investors to revalue their investment and started selling their holdings;
  • As selling continued, it became a self-fulfilling prophecy (due to herd mentality) and snowballed into a financial market crash.

In the aftermath of the Great Recession, the 3 most important central banks in the world (Federal Reserves, Bank of England, European Central Bank) deployed 2 key tools to stimulate the stalling economic growth:

  • Quantitative easing (QE): the creation of “cash” by central banks to purchase financial assets, increasing their price levels and maintain market confidence
  • Slashing interest rates: this lowered the cost of borrowing to encourage investors to take out debt capital and put them into productive use


How QE interacts with interest rates to stimulate growth? Source: BBC

The evidence: why the next financial crisis may be around the corner?

These 2 policies significantly increased the total liquidity in what was previously a stalling market. They were unarguably instrumental in the rapid economic recovery that followed suit. However, both instruments also led to a rapid increase (or recovery) in asset price across the spectrum because:

  • Significant demand-side pressure through QE
  • Negligible cost of borrowing (real interest rate was negative when compared to inflation in most developed markets), which further fuelled appetite for asset acquisition and exerted demand side pressure

As a result of over a decade of QE and low rates, most stock indices in developed markets have seen a rapid increase in valuation. This resulted in these assets being in a state of full price: intrinsic value plus market premium.

  • S&P500 index gained 260% between January 2009 and January 2019;
  • The Central London Property Index increased by over 100% between the trough in December 2008 and December 2017;
  • The Swiss Private Property Index displayed a steady performance between December 2008 and December 2016, increasing by 40%.

The sustainability of such valuation relies on the presence of 2 premises:

  1. An abundance of liquidity in the market (either through QE or low rate)
  2. Continued growth expectations

However recently there are signs that both factors are waning in today’s market, making the stock market valuation increasingly perilous.

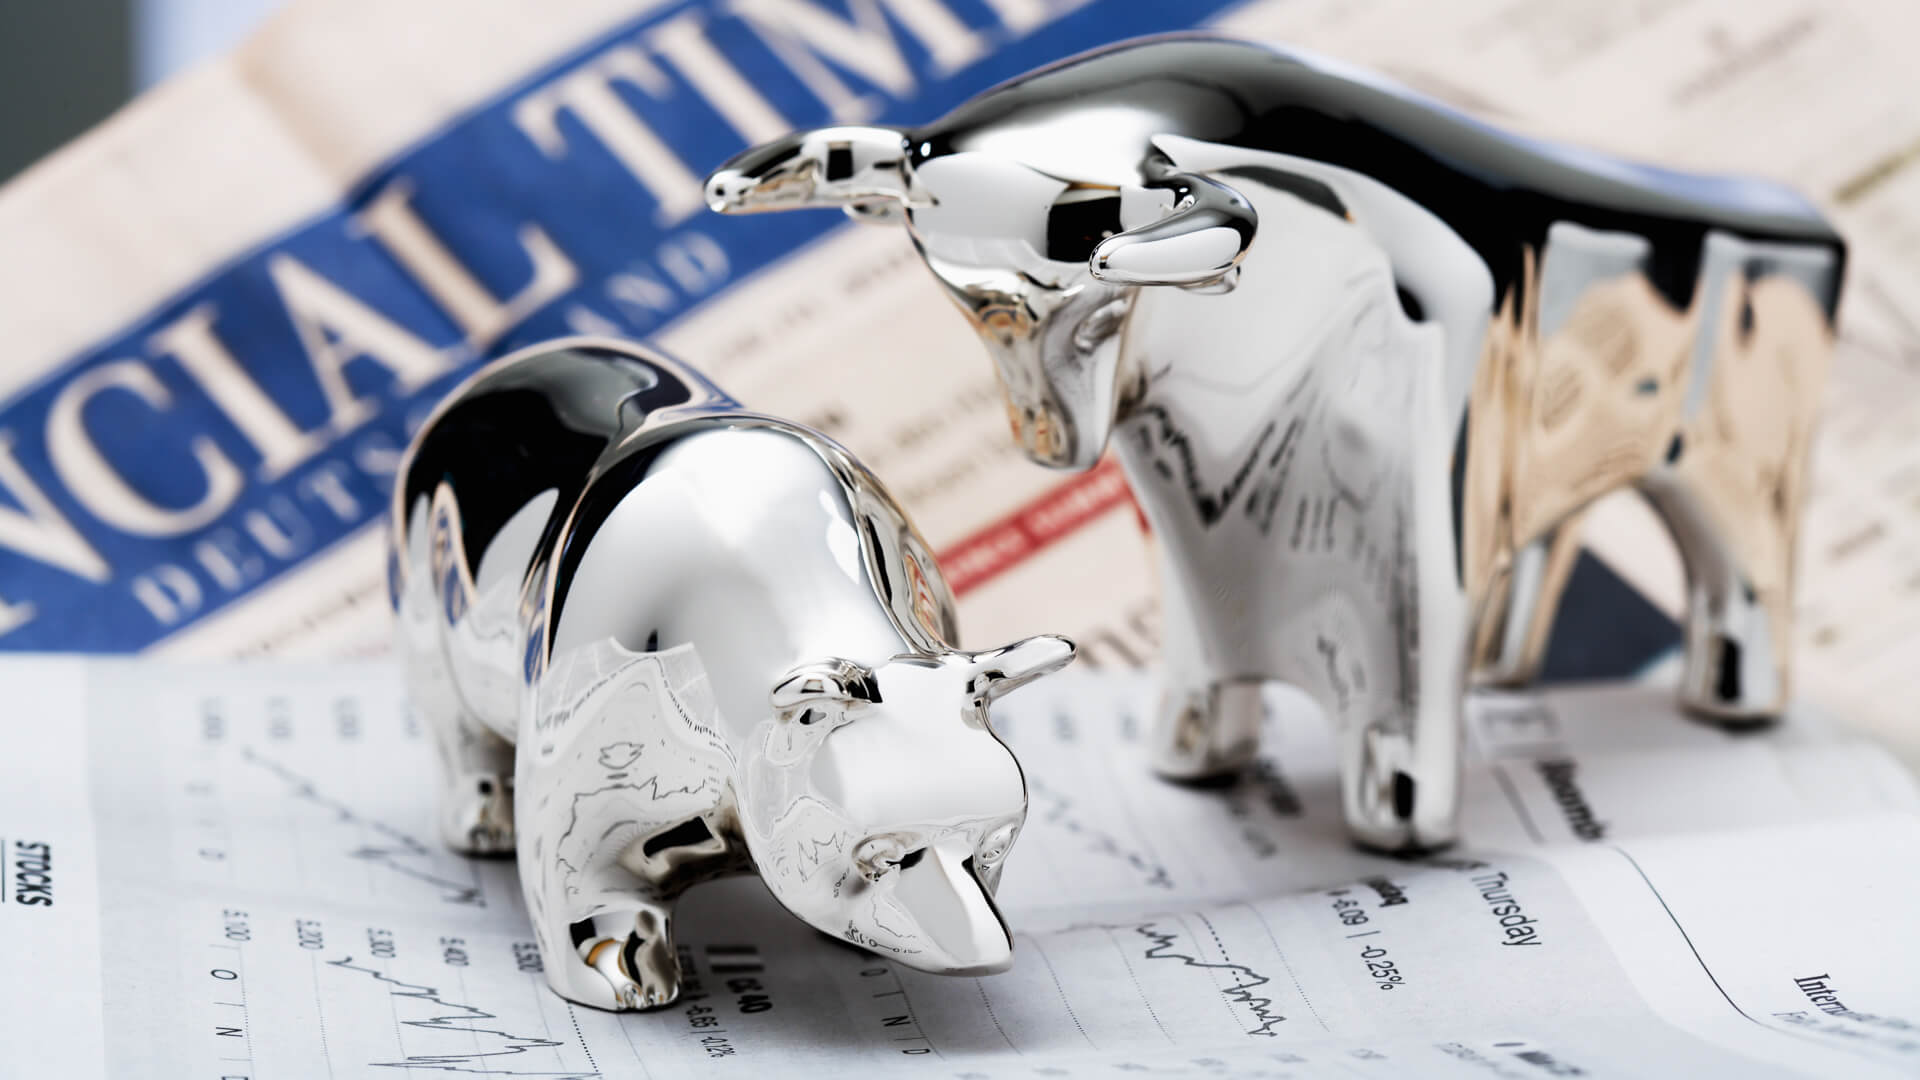
The two factors that will lead to the financial downturn in 2019-2020

There are 2 streams of headwind facing most developed economies, which are threatening the growth that we’ve enjoyed in the past decade:

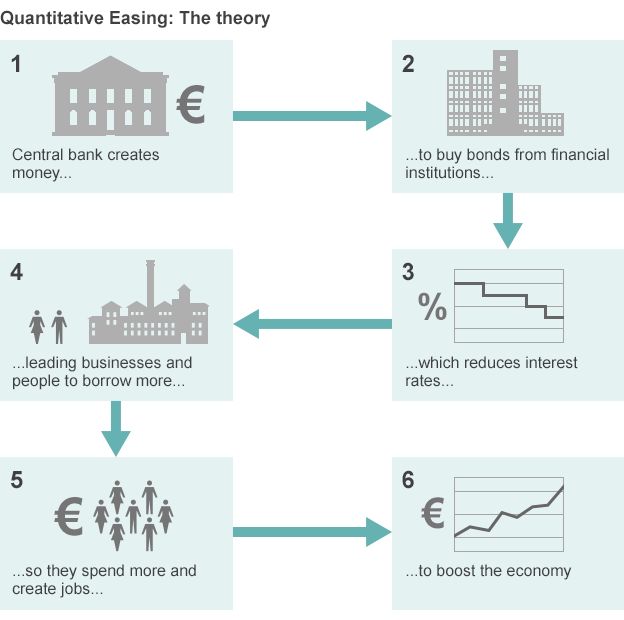
a) End of QE and rising interest rates

b) Inequality and the rise of social-political instability

Let’s explore these two points in-depth.

a) Rising interest rates and the eventual reversion to the mean in asset prices

At a simplistic level, when the debt/GDP ratio exceeds a certain point (between 100-200% depending on the country, the governor of the central bank and the macroeconomic climate), central banks tend to start tightening monetary policies in the form of raising the base interest rate. They will also start to impose stricter criteria on bank lending (e.g. which sector, what LTV ratio, etc), usually in the form of more stringent stress tests.

There are 4 key rationales behind tightening monetary policies:

  • Central banks aim to keep inflation low: when economic growth gathers momentum, price level tends to increase, which leads to inflation. The base interest rate becomes the primary regulator as it cools down economic growth and central banks will have to bring it up in order to manage inflation.
  • Controlled deleveraging: when the total debt within an economy exceeds a certain threshold, a large amount of the GDP will go towards interest payment, which is not the most productive use of capital. When companies pay an increasingly large amount of their profit to debt interests, it means lost investment in their employees (through training or better remuneration, which can be ultimately consumed to enhance growth) and lower tax revenue. Both are bad for economic growth.
  • Central banks want to create an environment for greater capital allocation efficiency: linked to #2, a blanket low rate across all borrowing may not be channeling capital into the most productive sector, therefore by imposing more stringent/selective lending criteria, central banks can attempt to direct capital into the desired sectors.
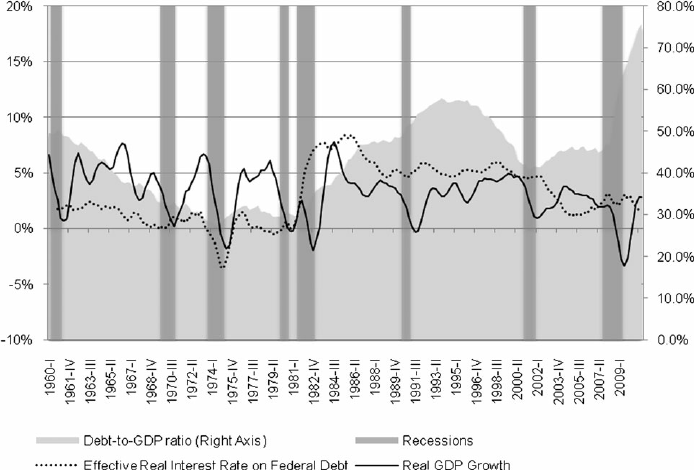
  • Central banks want to decelerate growth to prevent huge overheating, what will lead to even worse crises: investors believe that markets get nervous when the debt-to-GDP ratio exceeds a certain threshold and will automatically push up the cost of borrowing for governments, therefore central bankers would like to proactively decelerate growth to prevent overheating and enhance confidence.


The interest rate has historically moved in line with the debt-to-GDP ratio until recently
Source: ResearchGate

The overall effect is that at debt capital will become more expensive and difficult to access. The immediate impact would be a decrease in demand for financial and real assets, leading to a drop in their prices. If this is mishandled, it can lead to a vicious cycle where:

  1. Asset price decreases, leading to a drop in valuation;
  2. Debt-to-equity ceiling becomes breached, leading to less credit being available;
  3. Investment falls and income (profit) drops;
  4. Business becomes less valuable due to lower profitability, leading to a further drop in valuation;
  5. When magnified across the entire economy, growth stalls.

b) Inequality and the rise of social-political instability lead to the rise of populism and eventually to a greater economic downfall

The rapid asset price appreciation as a result of central bank policies had the unintended consequence of exacerbating economic inequality across developed economies. Three pillars contributed equally to this:

  • Increased asset price (induced by these policies) benefitted people with assets -> this meant the wealth gap between those with assets and those without were widened;
  • Increased asset price also made assets less affordable, thereby decreasing the probability of people without assets of ever acquiring them -> people already with assets could acquire them and end up with more assets -> wealth gap further widened;
  • Interest rate cut makes the cost of asset acquisition much lower than before. Borrowing at low rates became only accessible to people who already possessed assets.

So the poor become poorer, while the rich (who owned assets that went up) become richer.

“We have to be concerned about the wealth gap and the consequences geopolitically”, Ray Dalio

The link between rising inequality, growing social cohesion and by extension, political instability has been well-documented. Inequality fuels populism as we have seen with Brexit, the election of Trump, Salvini and the rise of AfD in Germany. Populist policies had historically been a headwind to long-term economic growth and therefore this decreases investors’ confidence in the future prospect of the global economy.

What will happen to your portfolio when the next tsunami hits?

Let’s assume that you find yourself in the midst of the next market downturn. What’s going to happen? What does it feel like? How will you react?
Let’s consider a hypothetical chain of events that might unfold in the foreseeable future:

  • After 2 years of chaotic negotiation, the UK crashed out of the EU without a withdrawal agreement, sending its entire economy into uncharted waters.
  • Sterling hit a 30-year low against dollars.
  • Protests in the street led to the resignation of Prime Minister May and a general election was held, leading to Jeremy Corbyn, a staunch socialist, being elected.
  • Business confidence plummeted as a result and corporate investment fell.
  • Amidst the chaotic political scene, much of the EU derivative contracts underwritten in London became legally unenforceable, causing massive losses to holders.
  • Market confidence plunged and the FTSE 100 was is down by 15% at the end of the week and 30% by month.
  • The UK economy suffered a sudden slowdown and was manifested across the EU due to the strong trading relationship historically.
  • The slowdown in the EU, in turn, spread across its own trading partners around the globe.
  • Investors began to cast doubt about the health of the global economy and major indices suffer dramatic falls and are down by 25% by the end of the month.

In this hypothetical case, here is the potential impact to your $100,000 portfolio, which is made of geographically and sectorally diversified ETFs, comprised of the classic 60-40 equity and bond combination:

  • The equity portion of your portfolio will drop by 25% from $60,000 to $45,000;
  • The bond portion will more resilient but can still drop by 15% from $34,000;
  • As a result, your portfolio will now be worth $79,000, suffering a 21% depreciation;
  • Corporate earnings may be slashed during a downturn, directly impacting dividend payout. It is entirely feasible to see a more than 15% drop in the dividend growth rate.

These are real and nominal losses in income and valuation respectively, which can affect investor psychology profoundly and cause them to panic sell, that in turn, exacerbate the drop in the market.

What can you do to insulate your portfolio now?

The easiest way to preserve your portfolio value during a downturn is to diversify your risk concentration before the market fully appreciates the risk.
Looking across the risk spectrum, in an ideal world, we need an asset that fulfills the following 2 criteria:

  • Located in a jurisdiction with high political, economic and legal stability as well as a favourable business environment. These factors are important for value preservation;
  • Capable of stable and increasing income generation, which will enable value enhancement.

Swiss real estate immediately springs to mind.
As a nation, Switzerland is blessed with some advantageous characteristics:

  • It is a small, stable and neutral country;
  • It hosts a highly advanced economy;
  • As a nation that enjoys strong bilateral ties with the EU and accepts freedom of movement, it is enjoying above-average population growth;
  • Total tourist arrival per year has been increasing consistently at 3% per year, even during the Great Recession;
  • The supply of properties is relatively inelastic (limited stock availability), therefore the average nightly rate will increase when faced with rising demand, enabling increasing income potential.

The Swiss property market has historically enjoyed balanced growth. Lately, it has seen a more aggressive trajectory due to the factors outlined above. Equally due to the strong demand-side support, the property price has remained stable, even during the Great Recession, which makes it an attractive hedge against market volatility elsewhere.

Looking at the historical performance data, the return and volatility of a mixed-class portfolio (with cash, equity, and bond) with or without a Swiss real estate component differ significantly. What it emphasizes is the hedging role the property plays in the portfolio: it reduces the amount of risk for a given level of return (the flip side of the coin is that it enhances the return at a given risk level). This is because research has demonstrated that Swiss real estates show little correlation (0.1) with other major assets, making it an ideal risk hedge. It also means that in the event of major market price movement, the value of your portfolio will remain relatively constant due to the value-preservation nature of holding Swiss real estate.


How do I get exposure to the Swiss property market?

There are a few different approaches and the exact methodology depends on investors’ personal preference and circumstances.


Asset Entry barrier Capital return / profit (pa) Capital protection Yield Liquidity Transaction cost Maintenance cost Example
Physical property CHF 200k min up to 4% Physical property <2% Low 1% 0.5-1.5% Any Swiss realtors
Fraction ownership in a real estate -related business CHF 50k N/A Physical property Up to 7% - 14% Low 0% 0% Le Bijou Owner’s Club
Real Estate Funds CHF 1k 3% Collateralised against the property 2% - 3% Low: if close-ended

High: if openly trading

0.01-1% 0.5-2% SXI Swiss RE Funds
Property bonds CHF 10k 0% Collateralised against the property 2% - 6.5% Low 0% 0% Le Bijou Bonds


Conclusion

We have enjoyed been enjoying a decade of extraordinary returns on the financial market. Such a long period of stability can often cloud our judgement and make us believe that this is the norm. Yet history tells us that this is far from the truth. The financial market is volatile and there are warning signs across the spectrum that a downturn might be around the corner. Fortunately, there are numerous options available to investors in today’s market to facilitate risk reduction whilst enjoying balanced return on their capital.

Source: the article was originally published at Starwerk.ch

Start InvestingInvest  Book CallCall  Join NowApply